


About the authors:Jan Weststrate, RN, PhD, is director of Care-Metric (health service quality improvement advisers), Raumati, New Zealand. Louis Boamponsem, PhD, is a quality assurance officer for the Laura Fergusson Trust (rehabilitation and support services), Canterbury & West Coast, New Zealand. Cathy Cummings, RN, DBA, is director and specialist advisor for the DAA Group (health certification and accreditation), Wellington. Andy Towers, MA, PhD, is a senior lecturer in the School of Health Sciences, Massey University, Palmerston North, New Zealand. This article was accepted for publication in August 2019. |
ABSTRACTAims: To identify compliance with the New Zealand Government’s health and disability services standards (HDSS) in aged residential care (ARC) facilities in 2016, compared with previous years’ outcomes, and its relationship with the surge of complaints in the public domain. Methods: The 2016 audit reports of 185 ARC facilities were compared with their previous audit reports. The level of attainment of the different service groups was quantified (5: continuous improvement – 1: unattained). Results: Audit reports of 185 facilities were included for analysis. Overall, the compliance with the standards improved from an average of 3.59 (± 0.80) to 3.76 (± 0.71). All service groups improved significantly over time, except for organisation and management. Number of beds and audit agency had no significant influence on the outcomes. Conclusions: Compliance with the HDSS of the ARC facilities audited in 2016 significantly increased from their previous audit. There appears to be a discrepancy between the outcome of this study and the perception of the public; however this study could not draw conclusions whether this discrepancy is directly related to an increase in poor performance. The question emerges whether the current standards reflect sufficiently the provision of good quality of care. |
||||
KEYWORDSquality, audit, compliance, improvement, aged care, certification, assessment, standards |
|||||
 Jan Weststrate
 Cathy Cummings
 Louis Boamponsem
 Andy Towers
INTRODUCTION
NEW ZEALAND IS EXPERIENCING a rising demand for aged residential care (ARC) facilities to accommodate a growing number of frail elderly. In 2011, approximately 31,000 New Zealanders were in ARC facilities: 5.1 percent of all people aged 65 and over, and 11.6 percent of all people aged over 80 (Productivity Commission, n.d.). In 2016, 14 percent of New Zealand’s population were aged 65 years and older. This will increase to 22 percent by 2034 (Davidson, Elkin, & Carey, 2016). New Zealand is one of the bigger spenders on health care, as a proportion of total government funding, among Organisation for Economic Co-operation and Development (OECD) countries (OECD, 2017). With a projected need for up to 20,000 additional ARC beds within the next decade (Grant Thornton, 2010), an increasing older population will clearly affect the provision of aged care in New Zealand.
At November 7, 2013, there were 663 accredited aged-care providers in New Zealand, the majority (68 percent) of which were privately owned, with a declining number operating on a not-for-profit basis (Grant Thornton, 2010; Ministry of Health 2013). The decision to invest in new long-term care facilities will therefore depend very much on profitability and return on investment. There is doubt such a market-driven care environment can appropriately serve frail elderly without the latter being the servant of the former (Woods, Phibbs, & Severinsen, 2017). In a market-driven environment, care providers must ensure that meeting an increasing ARC demand will not be at the expense of the quality of care. Residents in ARC facilities are some of the most vulnerable in our society, so effective assessment and assurance of care quality and safety is paramount (Controller and Auditor-General, 2009). It is therefore imperative for stakeholders to be regularly informed about the trend of certification audit outcomes, which are proxy indicators of quality of care for ARC residents.
This study investigates how much the outcomes of individual certification audits have changed over time and what factors possibly influenced this change.
Assessment of health and disability services standards (HDSS)
The New Zealand Health and Disability Services (Safety) Act 2001 requires that care provided by ARC facilities meets the health and disability services standards (HDSS). ARC providers must be certified by the Ministry of Health (the ministry) and, to remain certified, they must be audited regularly to make sure they meet the specified criteria set out in the HDSS. Much of this auditing is carried out by Ministry of Health-approved independent organisations called designated auditing agencies (DAAs). The ministry uses these audits as a basis for deciding whether an ARC facility can continue to operate, and for how long (New Zealand & Office of the Auditor-General, 2009) (Ministry of Health, 2013).
In addition to DAA auditing, local district health boards (DHBs) have a role in monitoring the quality of care ARC facilities provide. Most ARC facilities have a contract with their local DHB, which is required by law to monitor that facility’s service delivery and performance (Controller and Auditor-General, 2009). DAA audit reports are used by DHBs to ensure contracted ARC facilities are complying with the aged-related residential care services (ARRCS) funding contract (Productivity Commission, n.d.). ARC operators are then required to report to their DHB on how they are addressing issues found at audit, and such improvements are verified at the next audit (Ministry of Health, 2015).
Meeting the HDSS
A 2009 government audit found that since its introduction in October 2002, certification of ARC facilities had not provided adequate assurance that rest homes met the criteria in the HDSS (Controller and Auditor General, 2012). There was evidence that the rate of improvement had slowed, and some ARC facilities consistently received poor ratings for the same or closely related criteria. In addition, ARC facilities throughout the sector were often given poor ratings for some particular HDSS – eg the medicine management standard (New Zealand & Office of the Auditor-General, 2009).
Following these findings, the ministry strengthened its certification and monitoring processes. It integrated DHB and DAA assessments, increased audit frequency when “high” risks were identified, introduced unannounced auditing, reintroduced third-party accreditation of independent auditing agencies and shifted the focus of audits from process-driven to outcome-driven (Office of the Controller and Auditor General, 2012).
Neville, Wright-St Clair, Healee and Davey (2016) concluded that the changes to the audit process were beneficial to quality of care and improved outcomes for residents, resulting in an increased number of ARC facilities being awarded a four-year certification. However, in response to repeated complaints from consumers, a 2017 inquiry (New Zealand Labour Party, Green Party of Aotearoa New Zealand, & Grey Power, 2017) into the state of ARC found that significant problems first outlined in a 2010 inquiry (New Zealand Labour Party, Green Party of Aotearoa New Zealand, & Grey Power, 2010) still remained. These included inconsistent care, poor housing stock, a lack of focus on client health outcomes, and chronic workforce underfunding. However, these problems were not universal across the sector, with some ARC providers performing better than others.
A key issue for the New Zealand aged care sector is that there is no single report identifying the degree of improvement in the sector overall, and whether such improvement reflects specific characteristics of the ARC itself (eg regional variation, facility size) or specific aspects of the care provided (eg certain audit criteria). Such a report would significantly change our currently muddled understanding of ARC care improvement in New Zealand and the driving factors for such improvement. This study aims to explore these issues and will attempt to answer the following research questions:
1) To what extent have ARC facilities improved certification audit outcomes in 2016, compared to their previous certification audit results?
2) Which factors (size, audit agency and region) influenced audit outcomes?
3) Which criteria of the HDSS are ARC facilities repeatedly failing to meet?
METHODS
This study represents a secondary analysis of existing certification audit data gathered by DAA agencies in ARC facilities in 2016. This data is made freely available by the Ministry of Health. Specifically, we utilised all the qualified full audit reports from the ministry’s website of the facilities audited in 2016. Facilities that received other types of audits (surveillance audits, provisional audits, partial provisional audits) were excluded. For the selected facilities, we compared their 2016 results with the results of their previous certification audit. When no previous certification audit results were available, or no data were collected other than the 2016 audit results, only the 2016 results were used.
ARC providers are audited against the HDSS set out in the Health and Disability Services Act 2001 to gain certification. These standards are categorised into six service groups:
- consumer rights;
- organisational management;
- continuum of service delivery;
- safe and appropriate practice;
- restraint minimisation and safe practice; and
- infection prevention and control.
Each service group has several standards with associated criteria. The standards focus on the outcomes that residents experience when services are of good quality. Overall, there are 50 standards and 101 criteria within the HDSS that can be used for audits (Ministry of Health, 2015).
Each ARC is ranked on how well they achieve each standard or criteria, and the level of risk based on non-achievement. Table 1 shows the abbreviation, the level of attainment and the current interpretation of the attainment level. Where the attainment level is partial or unattained, a risk analysis is performed at criterion level. The risk may be determined as “negligible”, “low”, “moderate”, “high” or “critical”.
Table 1: The five levels of attainment
| Abbbreviation | Full wording | Achievement of standard or criteria |
|---|---|---|
| CI | Continued improvement | Achievement beyond full attainment |
| FA | Fully attained | Full attainment and meets requirements |
| PA | Partial attainment | Partial attainment and improvement required |
| UA | Unattained | Not met |
| NA | Not applicable | Standard or criterion not audited as does not apply |
Measures
Improvement: A numerical value (and colour) was assigned to the attainment levels for each service group: Continuous improvement (blue) 5; fully attained (green) 4; partially attained, low risk (yellow) 3; partially attained, high risk (orange) 2; unattained (red) 1. The maximum value for each audit report is therefore 30.
As well as facilities’ demographic data (name, DHB, number of beds, for profit/not for profit), the following data were collected from the audit reports:
- The date of the first day of the audit.
- The DAA agency that performed the audit.
- The region the ARC facility was located in. (The 20 DHBs in New Zealand are grouped into four regions – see Figure 1.)
- The certification period the facility was given, based on the audit.
- The level of attainment for each of the six service groups.
- The number of standards and criteria that were reported on for each of the attainment levels.
- Descriptions of criteria that were either rewarded with a continuous improvement (CI) rating, or criteria that required corrective actions (CARs) from the facility. (A description of these criteria only became publicly available for certification audits carried out after August 2013.)

Figure 1: The 20 district health boards in New Zealand grouped into
four regions. (Controller and Auditor-General, n.d.)
The following analyses were carried out:
- Audit outcomes (blue, green, yellow, orange and red) were compared at facility level, for each of the six service groups, between the 2016 audit results and the results of the previous audit, only for those facilities for which the two sets of data were available.
- Relationship between the size of the facility (number of beds) and audit outcomes.
- The change in reported numbers of CARs and CIs between the 2016 audit outcomes and the previous audit. The data were subjected to statistical analysis using IBM SPSS (Version 21). T-test, chi-square and one-way analysis of variance (ANOVA) were used to determine the statistical difference between groups. Where appropriate, a least significant difference (LSD) post-hoc test was applied following the ANOVA test. The level of statistical significance was set at 5 percent.
RESULTS
We analysed the 2016 certification audit reports for 185 ARC facilities in New Zealand. There was a previous certification audit report available for 152 of these facilities. Of those 152 facilities, 45 had a detailed previous audit report (this includes naming the specific criteria that required corrective action and/or received a CI rating); 107 did not, because before August 2013, only an abstract of the audit report was made public, not the complete report.
For the remaining 33 facilities (185 minus 152), no previous audit report was available. This was because, in previous years, no certification audits were performed for these facilities other than provisional and surveillance audits.
All the CARs and CI ratings of the 230 (185+45) detailed audit reports were also analysed. In total, we evaluated 1158 criteria (CI: 242 (20.9%); CAR: 916 (79.1%). In 2016, there were 855 (73.8%) criteria evaluated and for the previous years 303 (26.2%). In 2016, 627 CARs were recorded. Table 2 lists the five criteria of the HDSS, with their frequency, that were most often listed as CARs. These five criteria made up one third of all the CARs reported in 2016.
Table 2: The five standard criteria most often listed as CARs
(corrective actions required) in 2016
| Standard criteria | Description of criteria | N (CARs) | % of total CARs |
|---|---|---|---|
| 1.3.12.1 | A medicines management system is implemented to manage the safe and appropriate prescribing, dispensing, administration, review, storage, disposal, and medicine reconciliation to comply with legislation, protocols and guidelines. | 50 | 8.0 |
| 1.3.3.3 | Each stage of service provision (assessment, planning, provision, evaluation, review and exit) is provided within time frames that safely meet the needs of the consumer | 48 | 7.7 |
| 1.3.6.1 | The provision of services and/or interventions are consistent with, and contribute to, meeting the consumers’ assessment needs and desired outcomes. | 45 | 7.2 |
| 1.3.5.2 | Service delivery plans describe the required support and/or intervention to achieve the desired outcomes identified by the ongoing assessment process. | 35 | 5.6 |
| 1.2.3.6 | Quality improvement data are collected, analysed and evaluated and communicated to service providers and, where appropriate, consumers. | 32 | 5.1 |
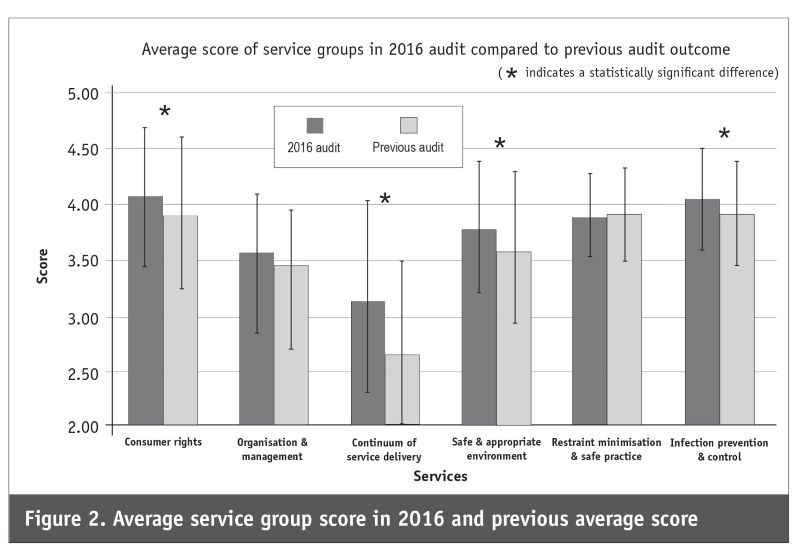
Figure 2 (above) shows the outcomes per service group. Overall, facilities in all regions had significantly better outcomes in 2016, compared to their previous audit outcome, suggesting improvement in compliance with the standards – mean 2016: 3.76 (+-0.71) vs mean previous: 3.59 (+- 0.80; p=.000). The service levels that contributed the most to this improvement were: consumer rights, continuum of service delivery, safe and appropriate environment and infection prevention and control.
Table 3 shows the overall average service level outcome for the 152 facilities per region (see Figure 1). For the year 2016, the data showed a significant difference (p<.05) in outcomes related to which of the four regions the facility was located in [F(3,908)=3.212, p=.022]. Post-hoc comparisons using the Games-Howell test showed the mean score for the South Island region (M=3.7093, SD=0.79) was significantly lower than the other regions. There was no significant difference between the mean scores of the four regions in the previous audit results.
Table 3: Average 2016 audit score per region, compared with previous audit score
| Region | N | N | 2016 audit | Previous audit | Sig | ||||
|---|---|---|---|---|---|---|---|---|---|
| (facilities) | (service levels) | Mean | SD | Std-error | Mean | SD | Std-error | (2-tailed) | |
| Northern | 40 | 240 | 3.8833 | 0.6229 | 0.04021 | 3.5708 | 0.86975 | 0.05614 | p=0.000 |
| Midland | 29 | 174 | 3.7184 | 0.67662 | 0.05129 | 3.6092 | 0.81682 | 0.06192 | p=0.135 | Central | 40 | 240 | 3.7333 | 0.70543 | 0.04554 | 3.6708 | 0.73466 | 0.04742 | p=0.274 | South Island | 43 | 258 | 3.7093 | 0.78705 | 0.049 | 3.5271 | 0.78485 | 0.04886 | p=0.001 |
Table 3 also shows there was a significant positive increase in service group scores for the facilities in the Northern region [conditions t(239)=4.897, p=.000] and the facilities in the South Island [conditions t(257)=3.473, p=.001], comparing the 2016 service level scores with the previous year audit scores using the paired T-Test. These results suggest that in 2016, the facilities in the Northern and Southern regions had a higher compliance with the standards than in the results of their previous audit.
Table 4 (below) shows the average service level outcome per bed size. Facility bed size was divided into four categories (0-49 beds, 50-99 beds, 100-149 beds, more than 150 beds). For the 2016 audits, there was a significant difference in scores between the four different bed sizes [F(3,908)=6.441, p=0.000]. Post-hoc comparisons using the LSD test showed the mean score of facilities with 0-49 beds was significantly lower than for facilities with 150-199 beds (p=0.031) and those with 100-149 beds (p=0.000). Also, facilities with 50-99 beds had a significant different average service level score than those with 100-149 beds (p=0.005). In the previous audit results, there was no significant difference between the mean scores of the four bed sizes.
Table 4: Average 2016 audit score per service level for each bed-size category,
compared with previous audit score
| Bed size | N | 2016 audit | Previous audit | Sig | ||||
|---|---|---|---|---|---|---|---|---|
| (facilities) | Mean | SD | Std-error | Mean | SD | Std-error | ||
| 0-49 | 420 | 3.6833 | 0.70268 | 0.03429 | 3.5976 | 0.79826 | 0.03895 | p=0.048 |
| 50-99 | 372 | 3.7769 | 0.6936 | 0.03596 | 3.5833 | 0.80164 | 0.04156 | p=0.000 | 100-149 | 96 | 4 | 0.71082 | 0.07255 | 3.6667 | 0.8165 | 0.08333 | p=0.000 | 150+ | 24 | 4 | 0.72232 | 0.14744 | 3.3333 | 0.8165 | 0.16667 | p=0.005 |
Investigating the difference in the average service level scores between the two audits at bed-size level, using a paired sample T-test, showed that for all four bed-size groups there was a significant difference between the two audits (p<0.05). These results suggest that regardless of the bed size, compliance with the standards improved over time.
Five DAAs conducted the 185 certification audits used for this study. The proportions of the audits carried out by the five DAAs were, in decreasing order: 59 percent, 29 percent, 8 percent, 7 percent and 1 percent. There was no statistically significant difference (p=0.791) between outcomes of audits conducted by the different agencies. This suggests there is no significant variation in the quality of the audits provided by the different audit agencies.
To identify what contributed to the improvement in compliance, the number of CIs and CARs were analysed. This data only became available in audits done after July 2013 (43 facilities). Table 5 (below) displays the average number of CI and CARs for the facilities. All 43 facilities had CARs in their audit report and 21 facilities (48.8 percent) had one or more CIs listed. For both ratings, a significant difference was noted between the 2016 audit outcomes and the previous audit. The CARs reduced from an average of 6.44 per facility to 4.28.
Table 5: Number of CARs and CI ratings handed out to a subset of facilities (N=43) in 2016, compared with their previous audit
| Service level | N | 2016 | Previous | Sig | ||
|---|---|---|---|---|---|---|
| avg | SD | avg | SD | |||
| Continuous improvement | 21 | 2.19 | 1.44 | 0.76 | 1.61 | 0.01 |
| Corrective action request | 29 | 4.28 | 4.42 | 6.44 | 5.62 | 0.04 |
DISCUSSION
This research investigated the extent to which ARC facilities’ compliance with HDSS changed for the better in their 2016 certification audit, compared with their previous audit. This could bring clarity to discussion on this topic, where different sources produce reports with contradictory conclusions (New Zealand Labour Party, et al, 2017; Neville et al, 2016). The main outcome of this investigation is that the overall compliance with the HDSS improved significantly (from 3.59 to 3.76). In a more detailed look, four of the six audited service groups improved by a statistically significant amount, and two (organisational and management and restraint minimisation) did not. Overall, this is good news for the sector, as it has been under considerable pressure in recent years over the quality of care and services it provides to residents (Wilson, 2014; Woods et al., 2017). Specifically, this indicates an impressive improvement in practice and in attention to audit requirements by the registered nurses and health-care assistants who work at the aged-care coalface.
The audit outcomes for ARC facilities in the Northern DHB region and in the South Island improved significantly. One of the reasons rest-home facilities in the Northern region improved could be due to participation in the First Do No Harm programme (First Do No Harm, 2012). Regular get-togethers focussing on learning how to improve quality of care and how to reduce the incidence of pressure injuries and falls may have contributed to an increase in compliance. Also, the fact that some DHBs use gerontology nurse specialists and nurse practitioners to work with ARC facilities to improve the quality of care may have contributed (Neville et al., 2016).
This overall improved compliance with the standards is supported by an increase in the number of CI ratings and a reduction in the number of CARs facilities were given. CI ratings are important to ARC facilities as they influence the number of certification years facilities are given (Neville et al., 2016). Audits are compulsory, expensive and financed by the rest homes themselves. So, in an already financially tight market, a decrease in audit costs can make a significant difference, especially for ARC facilities with a small number of beds. The bed size of the facilities had no significant influence on their audit results.
The reliability of our results is also supported by the fact that we could not detect a significant difference in the average compliance score of ARC facilities when different DAA agencies carried out the audit. Although there is not necessarily a causal link between audit company and outcome, it supports the observation that the different DAAs carry out the audits in a similar way. Audit quality was one of the concerns noted in the 2009 Controller and Auditor-General report (2009). In the follow-up report, the office of the Controller and Auditor-General mentioned that there were “indications that the quality of the auditing process for rest homes has improved during the last two years” (Office of the Controller and Auditor General, 2012, p35).
Interestingly, although this study shows increased compliance with the standards by ARC facilities, this has not led to the public experiencing an overall increased positive experience of the quality of care. An inquiry into aged care in New Zealand by the New Zealand Labour Party, the Green Party of Aotearoa and Grey Power showed that many of the issues mentioned in a 2010 report remained (Duff, 2013; Duff & Blundell, 2013; New Zealand Labour Party, Green Party of Aotearoa, & Grey Power, 2017; Wilson, 2014). This raises the question whether evaluating the compliance with the standards provides enough assurance to the public that ARC facilities care for the elderly in a respectful and dignified way (Carryer, 2016).
There are several formal ways for the public to complain when rest-home residents receive suboptimal care. People can talk directly to the management, write to the DHB in which the rest home is located, write to the Ministry of Health or complain to the Health and Disability Commissioner. The fact that there are multiple complaint avenues can confuse people and encourage them to take the path of “least resistance” (ie least effort), which is not necessarily the most effective one. This may be one of the reasons people approach newspapers or other media outlets, as the media are usually quick to respond to this kind of news. Different agencies may deal differently with the complaints they receive and it becomes difficult to rule out duplication, ie when the same complaint is sent to different agencies (Davidson et al., 2016). One of the suggestions made by the Productivity Commission to overcome these pitfalls is to create a shared contact point (an 0800 number) where complainants can be referred to the most appropriate organisation.
A relevant question, however, is what can be done to close the gap between what the sector is doing to improve compliance with standards of care and what the public experiences. Castle and Ferguson (2010) argue that measuring the quality of care in an ARC setting is not straightforward when aligning it, for example, with the Institute of Medicine’s definition of quality: “The degree to which health services for individuals and populations increase the likelihood of desired health outcomes and are consistent with professional knowledge” (Lohr, 1996). Putting such a definition into operation, to create quality of care measures for ARC facilities, is problematic, especially when you want to focus on person-centred care (Grabowski et al., 2014). Castle and Fergusson (2010) suggest that rather than looking at one or more quality measures for ARC facilities, it might be more appropriate to focus on quality indicators. Although they are less precise, they denote the quality of care provided. Using the Donabedian quality framework (Donabedian, 1985) of structure, process and outcome (SPO) helps to organise which quality indicator fits under which heading. Although the SPO model was not specifically designed for rest homes, it has a built-in logic that may resonate with the experiences of the public: good structure facilitates good processes, which facilitate good outcomes. Comparing the SPO approach with the current audit system in New Zealand, it is evident that the current standards focus mainly on structure, to a limited extent on process, and not on outcome.
In the complaints that have been aired in the media and submitted to the Health and Disability Commissioner, a substantial number of issues relate to health outcomes such as incontinence, pressure injuries, malnutrition, pain, falls and wound care (Davidson et al., 2016). In the last 20 years, the predominant thinking has been that to improve the quality of care in ARC facilities, the focus should be more on these type of quality indicators (Castle & Ferguson, 2010). This view is echoed in the most recent Labour, Greens and Grey Power report (New Zealand Labour Party et al, 2017). There are also international examples of standards regimes for which facilities are required to report on specific quality indicators (Australian Government Department of Health, 2016; Agency for Healthcare Research and Quality, n.d.; European Commission, 2010).
Based on these national and international developments, the way to close the gap between what the public experiences and what facilities do to create a safe and a high-quality care environment is to add important quality indicators (process and outcome) to the current audit process. The findings of the Health and Disability Commissioner report can be a guide to which process/outcome indicators are currently relevant (Health and Disability Commissioner, 2016). There are a number of ways to facilitate this change, one of which is that facilities take part in external accreditation programmes that include these in their accreditation process. Williams et al (2017) found that rest homes in the United States that took part in the Joint Commission’s external accreditation programme had fewer deficiencies compared to those that did not take part (Williams, Morton, Braun, Longo, & Baker, 2017). The Nursing Home Compare quality measures data set, which looks at 18 process and outcome quality indicators, is part of this accreditation programme (Centers for Medicare and Medicaid Services (CMS), 2018).
One external accreditation programme that already exists in New Zealand is EQuIP (evaluation and quality improvement programme). EQuIP is owned by the Australian Council for Healthcare Standards and is based on principles which support best practice and which are designed to facilitate a culture of continuous improvement. These principles can be applied to all aspects of service in a health-care organisation. This quality assessment and improvement programme supports excellence in aged care. The EQuIP standards comprise a series of criteria and elements, arranged under grading ratings that reflect increasing maturity of an organisation’s quality improvement activities.
Another existing international programme which connects well with the current audit process is the National Care Indicator Programme (NCIP) (Carryer et al., 2017). This programme focuses on pressure injuries, malnutrition, continence and falls, with an option to add an additional module for wound care/wound infection and pain management. These are also the issues about which the Health and Disability Commissioner receives the most complaints (Health and Disability Commissioner, 2016). Addressing these issues and publicly sharing the results for each facility could increase the public’s confidence that all is done to make sure loved ones receive the care they need.
LIMITATIONS
This study has a number of limitations. We evaluated the audit results of 185 facilities that had an audit performed and reported in 2016. From the table that we used to select the facilities, the licence end date was sometimes different from the actual date of the audit. This was particularly the case for facilities that had their audit done around the start of the year. It is possible that because of this we missed the audit results of a few facilities.
Another limitation is that full audit reports only became available after August 29, 2013. Therefore we have no indication of the number of CARs and CIs in the 2012-2013 period for those facilities that had longer certification periods (three to four years). Therefore, facilities for which we were able to evaluate the number of CARs and CIs may have had a shorter certification period, possibly indicating there were compliance issues in a previous report.
It should also be acknowledged that compliance audits – while robust and involving triangulation of evidence, including interviews with staff, residents, family members and management, and observation of care practice and its associated documentation – are only one tool in a toolbox that monitors quality of care. Audits assess and test the resilience of systems that support the delivery of care. The auditors are on site for about two days, every 18 months or so. Between audits, those systems can change or be eroded. The most significant thing that can affect the resilience of these systems is a change in ownership or, even more significantly, a change in management or leadership. Auditing is necessary for monitoring the aged-care sector, but it is not a guarantee of perfection.
CONCLUSION
This evaluation demonstrates that there is an increased compliance with the audit standards in facilities that were audited in 2016, compared with their previous audit. This is good news as it indicates the sector is putting an effort into increasing the quality and safety of the care it provides. Unfortunately, such a finding does not always go hand-in-hand with the New Zealand public’s experience of the quality of care provided by ARC facilities. A way forward is to include in the audit process the results for quality of care indicators that resonate with the public. The types of complaints submitted to the Health and Disability Commissioner’s office can give guidance on which indicators to include.
CONFLICTS OF INTEREST
Nil.
REFERENCES
Agency for Healthcare Research and Quality. (n.d.). Nursing Home Quality Measures Compared to Achievable Benchmarks.
Australian Department of Health. (2016). Residential aged care quality indicators.
Carryer, J. (2016, June 12). Aging with dignity is a basic right. Massey University.
Carryer, J., Weststrate, J., Yeung, P., Rodgers, V., Towers, A., & Jones, M. (2017). Prevalence of key care indicators of pressure injuries, incontinence, malnutrition, and falls among older adults living in nursing homes in New Zealand. Research in Nursing & Health, 40(6), 555–563.
Castle, N. G., & Ferguson, J. C. (2010). What Is Nursing Home Quality and How Is It Measured? The Gerontologist, 50(4), 426–442.
Centers for Medicare and Medicaid Services (CMS). (2018). Design for Nursing Home Compare Five-Star Quality Rating System: Technical user’s guide.
Controller and Auditor-General. (n.d.). Map of the four health sector regions and their district health boards.
Controller and Auditor-General. (2009). Effectiveness of arrangements to check the standard of services provided by rest homes.
Controller and Auditor General. (2012). Effectiveness of arrangements to check the standard of rest home services: Follow-up report.
Davidson, N., Elkin, K., & Carey, D. (2016). Complaints to the Health and Disability Commissioner about Residential Aged Care Facilities: Analysis and Report 2010–2014. Health and Disability Commisioner.
Donabedian, A. (1985). Twenty years of research on the quality of medical care: 1964-1984. Evaluation and the Health Professions, 8, 243–265.
Duff, M. (2013, September 25). Flood of rest home complaints. Stuff.
Duff, M., & Blundell, K. (2013, February 9). Rest home failed all its residents, ministry says. Stuff.
European Commission. (2010). Measuring Progress: Indicators for care homes.
First Do No Harm. (2012). First, Do No Harm website goes live.
Grabowski, D. C., O’Malley, A. J., Afendulis, C. C., Caudry, D. J., Elliot, A., & Zimmerman, S. (2014). Culture change and nursing home quality of care. The Gerontologist, 54(Suppl 1), S35–S45.
Grant Thornton. (2010). Aged Residential Care Service Review.
Health and Disability Commissioner. (2016). Complaints to the Health and Disability Commissioner about Residential Aged Care Facilities: Analysis and Report 2010–2014.
Lohr, K. N. (1990). Medicare: A strategy for Quality Assurance. National Academy Press.
Ministry of Health. (2013). Rest home certification audits.
Ministry of Health. (2015). More about audit reports.
Neville, S., Wright-St Clair, V., Healee, D., & Davey, J. (2016). Improving Outcomes in Age Residential Care. Auckland University of Technology.
New Zealand Labour Party, Green Party of Aotearoa New Zealand, with Grey Power. (2010). A Report into Aged Care. What does the future hold for older New Zealanders?
New Zealand Labour Party, Green Party of Aotearoa New Zealand, with Grey Power. (2017). Inquiry into Aged Care.
Organisation for Economic Co-operation and Development (OECD). (2017). Health at a Glance 2017 (p135). OECD Publishing.
Productivity Commission. (n.d.). Case Study: aged care regulation.
Williams, S. C., Morton, D. J., Braun, B. I., Longo, B. A., & Baker, D. W. (2017). Comparing Public Quality Ratings for Accredited and Nonaccredited Nursing Homes. Journal of the American Medical Directors Association, 18(1), 24–29.
Wilson, J. (2014, August). Compromised care. Rest home audits continue to show failings in care. Consumer New Zealand, 12-14.
Woods, M., Phibbs, S., & Severinsen, C. (2017). ‘When morals and markets collide’: Challenges to an Ethic of Care in Aged Residential Care. Ethics and Social Welfare, 11(4), 365–381.
Daily doses – uncut news
| 5 Oct |
Labour's pay rise a first step, but pay equity needs a full settlementTōpūtanga Tapuhi Kaitiaki o Aotearoa NZNO has welcomed Labour's promised pay rise for care and support workers as a first step. It says care and support workers now need a full settlement of their pay equity claim and a workable pay equity system for all of its members. |
| 1 Oct |
Health NZ releases first national report on serious adverse eventsHealth New Zealand has published its first national Serious Adverse Event Report, acknowledging the serious harm experienced by patients and whānau and outlining the improvements identified and actions underway to strengthen patient safety. The report covers serious adverse events reported in Hospital and Specialist Services between 1 July and 31 December 2025. |
| 25 Sept |
380 more health care workers at the end of winter too little too lateAn announcement of 380 additional nurses, midwives and health care assistants for hospitals around the country at the end of winter is too little too late, NZNO says. |
| 23 Sept |
Auckland University research finds nurse shortages increase post-surgery deaths and complicationsNew research by Auckland University has found addressing nurse shortages in post-operative care may save 182 lives a year because short-staffed wards have higher rates of potentially preventable deaths and complications after their surgeries. |
| 21 Sept |
Whanganui Hospital ED averaged 680% capacity over a week Working in an overcrowded emergency department (ED), up to 680% capacity over a week, makes staff feel overwhelmed with the pressure, Tōpūtanga Tapuhi Kaitiaki o Aotearoa NZNO says.
|
| 14 Sept |
WellSouth's Newborn Enrolment Kahu Taurima Programme a finalist at the Primary Care Awards 2026WellSouth's Newborn Enrolment Kahu Taurima Programme is a finalist at the Primary Care Awards for the HALEO Best Supplier Service, Product or Campaign category. Winners will be announced on 17 October. |
| 14 Sept |
Global Study: Nursing Shortages Require Workforce Policy Solutions, Not Recruitment Campaigns AloneWhy people choose nursing, and why they leave, comes down to the same factors. The global nursing shortage cannot be solved simply by encouraging more people to enter the profession, according to a new evidence brief. |
| 8 Sept |
Overworked, understaffed Gisborne ED staff strike Health and safety concerns arising from unsafe staffing levels have forced nurses at Gisborne Hospital’s emergency department (ED) to go on strike.
|
| 4 Sept |
Strong growth in wāhine Māori and Pacific women’s cervical screening rates highlights success of self-testing programmeCervical screening participation has increased significantly for both wāhine Māori and Pacific women, reflecting the strong impact of self-testing, Screening Services and the dedicated efforts of health providers working alongside their communities. |
| 4 Sept |
Government must adopt Wai 2713 recommendations on disability systemThe Coalition Government must urgently adopt new recommendations from the Waitangi Tribunal which has found significant parts of the disability system prejudice tāngata whaikaha Māori (Māori with disabilities), NZNO says. |
| 31 Aug |
Employing graduate nurses will help keep them in nursing and the countryA new proposal that will require Te Whatu Ora to offer all eligible graduate nurses jobs in the public health system will help keep them in nursing and in Aotearoa New Zealand, NZNO says. |
| 26 Aug |
Health Minister’s claim Winter Plan ‘managing well’ delusionalHealth Minister Simeon Brown’s claim that hospitals are ‘managing well’ because of the Government’s Winter Plan is delusional, NZNO says. |
| 25 Aug |
Hospital data shows nursing shortages continue to put patients at riskTe Whatu Ora data released today shows patients are continuing to be put at risk by the Coalition Government’s deliberate failure to safely staff hospital wards, NZNO says. |
| 24 Aug |
Fed-up North Shore ED staff declare state of emergencyNZNO members working in the emergency department (ED) at North Shore Hospital have declared a state of emergency due to unsafe staffing levels resulting in ongoing overcrowding. |
| 19 Aug |
What happened to the winter health plan?The $25 million 2026 Winter Plan launched by Health Minister Simeon Brown in March to erase pressure on the health system has been an unmitigated disaster, Tōpūtanga Tapuhi Kaitiaki o Aotearoa NZNO says. |
| 11 Aug |
Applications open for advanced nursing education programmesHealth New Zealand is encouraging registered nurses to apply for two advanced education programmes that support nurses to further develop their clinical skills and expand access to care in communities across New Zealand. |
| 3 Aug |
Health New Zealand welcomes settlement of NZRDA collective agreementHealth New Zealand welcomes the vote by New Zealand Resident Doctors Association (NZRDA) members to settle their collective agreement. |
| 30 Jul |
Backing our frontline rural health workforceRural communities across New Zealand will benefit from three new investments that will support the rural health workforce and help more people access care closer to home, Associate Health Minister Matt Doocey says. |
| 22 Jul |
Te Whatu Ora must disclose staffing levels at time of tragic deathTe Whatu Ora must disclose whether the Waikato emergency department (ED) was short-staffed at the time a man tragically died in the waiting room, NZNO says. |
| 6 Jul |
Reflecting on IND 2026Looking back on last month’s International Nurses Day 12 May 2026 (IND 2026), the impact of this year's theme "Our Nurses. Our Future. Empowered Nurses Save Lives" continues to resonate across the world. ICN’s landmark IND 2026 report defined seven key powers of nursing and this message has been strengthened with nurses in every region celebrating, naming, and owning their powers throughout May. |
| 3 Jul |
Health New Zealand acknowledges Ombudsman statement on Wakari Ward 10AHealth NZ welcomes the independent investigation by the Ministry of Health into Ward 10A. On Wednesday the Health NZ board agreed to close Wakari Ward 10a as a forensic intellectual disability (ID) unit, with the future use of the ward yet to be determined. |
| 2 Jul |
New programme to fast track bowel cancer care and cut colonoscopy waitlistsHealth New Zealand is today launching a national initiative, designed to fast track bowel cancer care and reduce colonoscopy waitlists by up to 30 per cent. |
| 1 Jul |
Six new Co-Response Team locations announced to strengthen support for people in mental distressThe next six locations for Health New Zealand and NZ Police Co-Response Teams have been confirmed, expanding a model that helps people experiencing mental distress receive timely, wraparound support that better meets their health needs. |
| 29 Jun |
Mental health and addiction targets progress continuesHealth New Zealand continues to make important progress against its mental health and addiction targets, meeting four out of five national targets this quarter. |
| 25 Jun |
Access to care continuing to improve across a range of health indicatorsNew health data released today shows continued improvement in access to care across a range of health indicators. |
| 18 Jun |
Funding "boost" continues dangerous under-funding of aged careThe Health Minister’s funding "boost" for aged residential care continues underfunding to the sector and will continue unsafe practices and short staffing, which is putting vulnerable residents at risk, NZNO says. |
| 16 Jun |
Labour to make maternity scans freeLabour will add free maternity scans to the Medicard alongside three free doctor’s visits a year, so every pregnant woman gets the care she needs. |